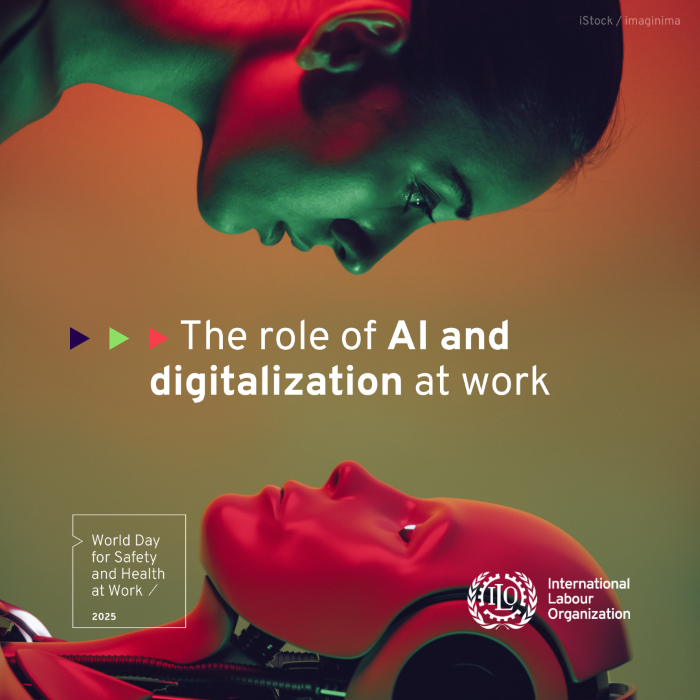
With this year’s theme for World Day for Safety and Health at Work being on the role of AI and digitalisation at work, it got me thinking about data and how we’re using it (or not using it as is so often the case).
Data rich, time poor
We live in a time where we’re data rich and time poor. We’ve all been told that ‘big data’ and machine learning will change our lives. We have a wealth of data available at our fingertips, even Microsoft wants to tell me when I’ve had too many meetings for my wellbeing! But there’s no point in having all this data if you can’t use it to help you make decisions.
We noticed this with our customers. They weren't always able to regularly access the dashboard to review their plant pedestrian activity. We introduced a weekly report that presents your highest risks for the previous week. Who entered the vehicle’s exclusion zone the most times, which vehicle, what time of day, and what day of the week. All this is surmised on one page that lands in your inbox on a Monday morning for you to act on.
The risks of not using it
I recently attended a virtual mock trial where they were reviewing a case of an employee being killed by a vehicle. The prosecution’s case was built on reported safety issues that hadn’t been addressed by the ‘fictional’ company. The defence was relying on ‘human error’. The verdict found the company guilty with a hefty fine based on the incident being a High Culpability and High likelihood of harm. This was a good reminder of the seriousness of not acting on reported safety concerns.
The same applies to data. If you have access to data and don't use it, this could be used in a court of law against you. This could be sifting through videos from CCTV or a vehicle’s camera or not analysing near misses. Our plant pedestrian trend data allows you to easily spot patterns of behaviour so that you can address them. You could identify staff that need retraining, change traffic layouts, add barriered walkways or change working patterns to reduce the risks on site.
One customer I worked with noticed they were getting several entries into the exclusion zone of their loading shovel all at the same time. When they reviewed this on site, they could see that their picking line staff were going on break and walking behind their loading shovel. This allowed them to put in place a protocol that the vehicle must be stopped and ignition turned off before the staff crossed the yard, removing the risk. Without the data this may not have been brought to light until it was too late.
Discrepancies between self-reporting and the facts
It's widely known that at least 50% of near misses don’t get reported. And this can mean that data isn’t always showing you the true picture. If we look at the difference between the Labour Force Survey in 2023/24 which shows non fatal injuries sustained by workers according to self reports. In 2023/24 this was 604,000. Compared to RIDDOR employee non-fatal injuries as reported by employers in 2023/24 which was just 61,663. This is about 10% of the self reported injuries! Of course we must consider the criteria of RIDDOR, but even so there’s a massive discrepancy in the data
We know from the Heinrich Accident Triangle that if not addressed, near misses can become minor injuries and then fatal injuries. If we’re not getting data about near misses or minor injuries, how can we stop the fatal injuries happening?
Data from safety systems such as our Proximity Warning System or our Smart Loader for RCV bin lifts report the facts. We distil this down to simple, key points that can be easily acted on. But you still need a human to view this data in the context of the environment (i.e. your site and operations) to make informed changes and improvements. So, we’re not going to be replaced by AI robots just yet!
Look at the report that the International Labour Organisation (ILO) have published for World Day for Safety and Health covering the benefits and risks of digitalisation to transform Safety and Health at work.


